Knowing when to repair and when to replace campus assets
As buildings age, their condition naturally deteriorates. For buildings on the UBC Vancouver Point Grey campus, Facilities invests in maintenance, repairs, and renewals (i.e. strategic maintenance) until it is time to ultimately replace the building with a new one (i.e. capital investment). Each building on campus serves a unique purpose so the balance between strategic maintenance and capital investment is unique to each building.
To measure the condition of each building, Facilities uses a Facility Condition Index (FCI) score and use that score to understand the big picture.
To learn more about UBC’ capital investments, visit UBC’s Capital priorities .
What is the Facility Condition Index?
Facility Condition Index (FCI) is the total cost of needed building repairs and renewal divided by the current cost of replacing the building. Each building’s FCI score reflects the current condition of the building: good, fair, poor, or critical. It is normal to see buildings in all stages of condition.
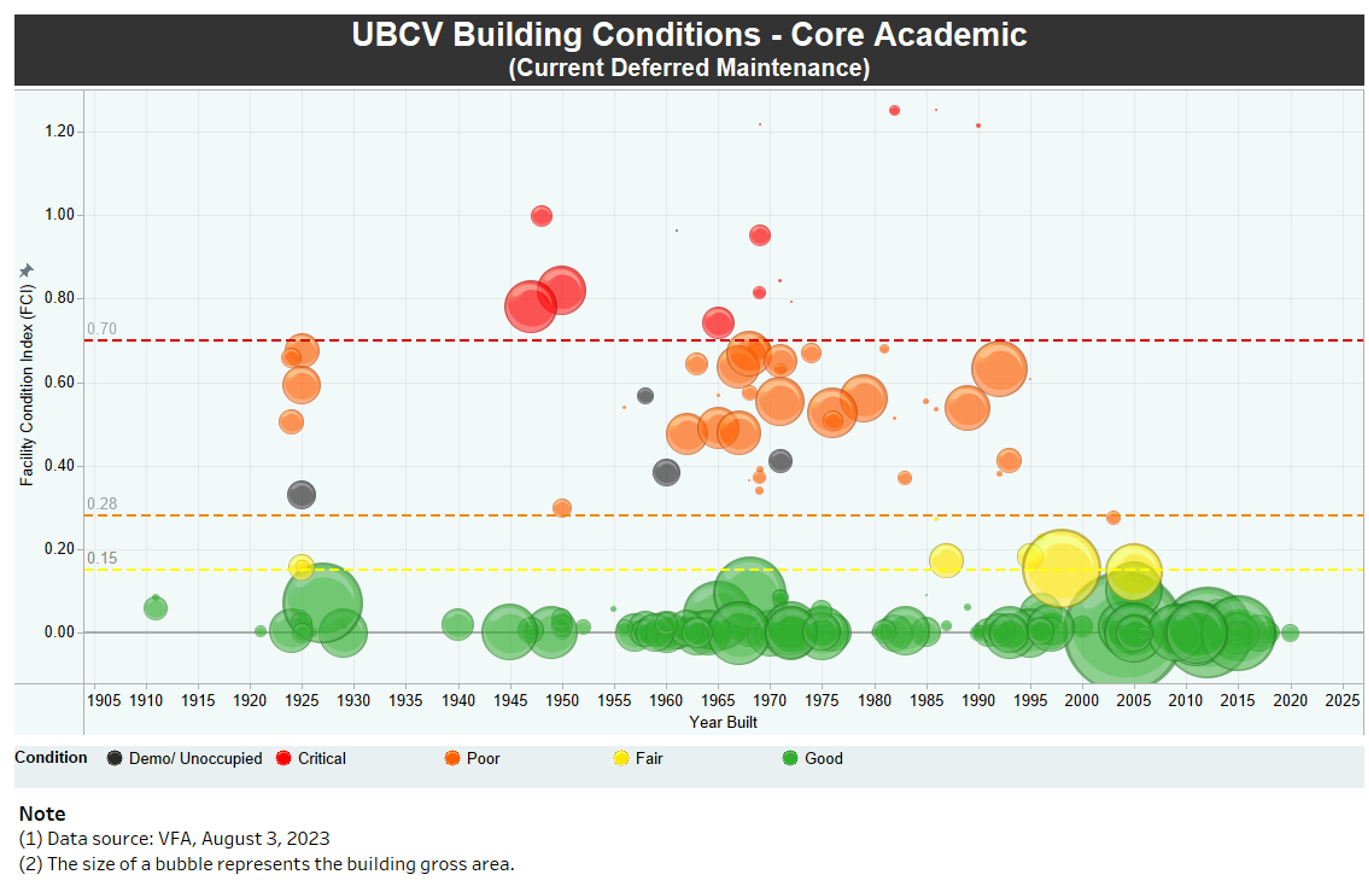
The bubble diagrams below [Diagram 1 and 2] shows the condition of our core UBC owned buildings as assessed by the Ministry of Post-Secondary Education & Future Skills (formerly Ministry of Advanced Education and Skills Training) in 2022, augmented by renovations completed to date after that audit.
The size of the bubble represents the building’s square footage — so bigger buildings are larger bubbles.
The colour represents the classification of the condition
- Green is good: These buildings are generally the newer and renewed buildings
- Red is critical: These buildings are generally older buildings with end of life systems or equipment.
- Yellow is fair
- Orange is poor
In Diagram 1, the bubbles shows a 5-year projection of the total deferred maintenance if we do nothing to improve the condition of the buildings. It shows the condition of the buildings at the end of the 5-year period, which is FCI at 0.31.
In Diagram 2, on the other hand, shows the amount of deferred maintenance of the buildings as of this year, which is a more accurate representation of the current building conditions, which is FCI at 0.05.
It is important to note that FCI is a snapshot in time.
Diagram 1: Deferred maintenance projection in 5 years
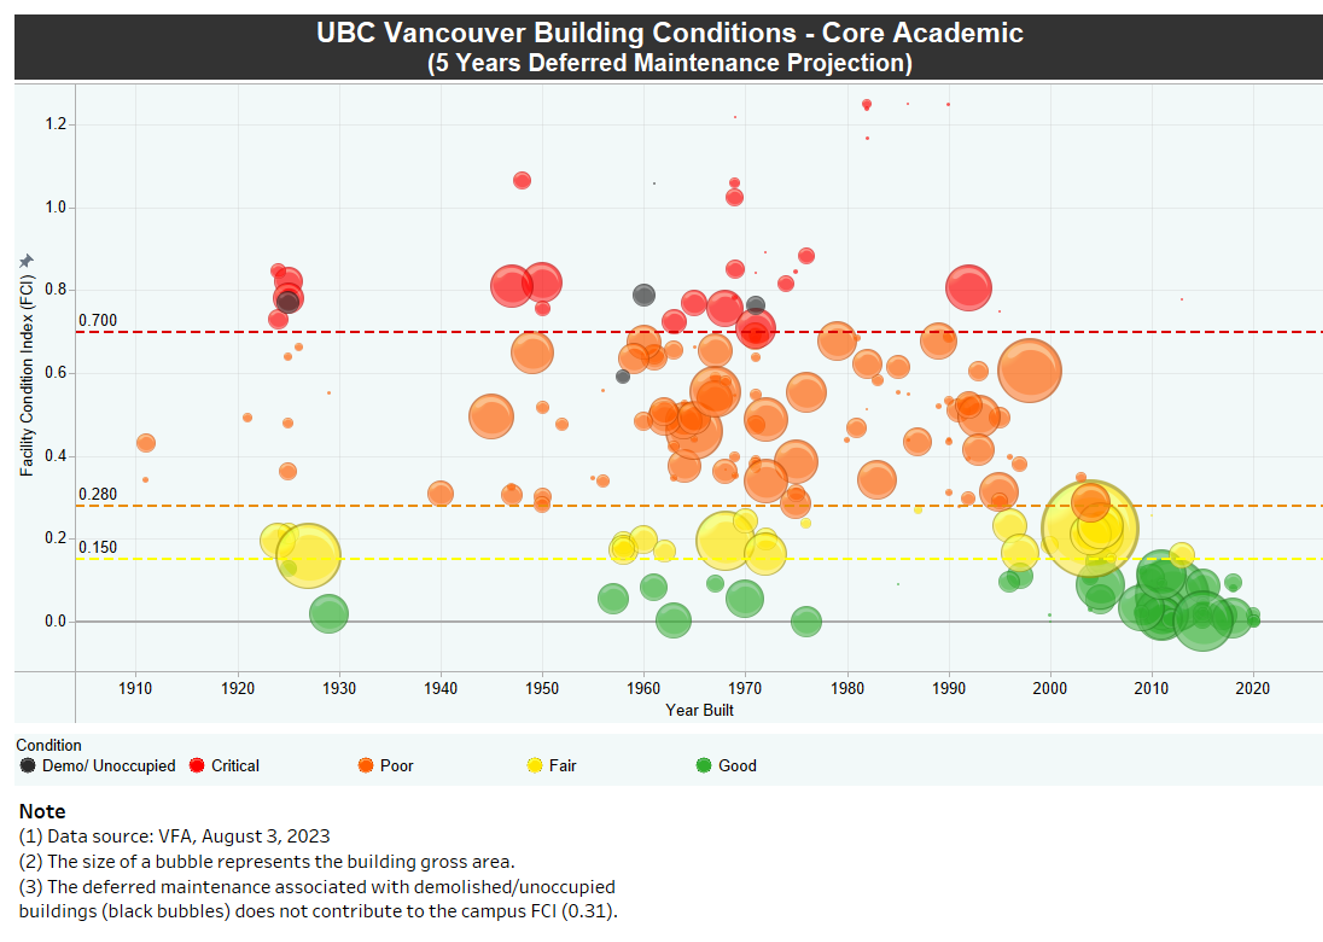
Diagram 2: Current deferred maintenance
Seeing our investments make a difference in building conditions
There are two ways we can improve a building, through capital investment or strategic maintenance. Facilities is working to find the best blend of both.
For example, in the 2022 assessment, the data shows the following:
- Our current overall FCI is in the high orange zone (i.e. poor). We are actively repairing and maintaining our buildings to meet the yellow zone over the next 10 years. However, when the building is categorized as poor, it indicates that Facilities is spending too much time being reactive to repairs, and money is wasted.
- The focus should be on our minor capital projects on the buildings in the high orange area to reset these buildings down below the red line.
- The focus should also be on our strategic operations and maintenance for the green and yellow buildings to keep them from trending above the orange line.
- Many of our critical buildings are slated for major renewal or demolition (Powerhouse, Museum of Anthropology, Jack Bell Building). Once these projects have been completed, our overall building condition will improve.
In 2022-2023, we completed $47 million worth of capital projects funded jointly by the Government of British Columbia’s Ministry of Post-Secondary Education & Future Skills and UBC; this represents a fraction of our total capital spend on new buildings.
How does FCI inform our financial strategy?
Facilities goal is to reach an FCI of 0.18, a condition of buildings that demonstrates that we are spending funds in the wisest possible manner when considering the cost of a building’s repair and maintenance relative to its overall lifespan. This would mean that we are not solely relying on historical spending, and we can use the facility condition data to articulate the need for a more precise amount to be spent in any given year to provide a balance between reliable spaces and spending capital dollars.
As stewards of campus assets, it is important that our financial management builds trust with campus stakeholders so that UBC continues to reinvest in us.